

Tutorial: Observing Seasonal Changes with Satellite Imagery
Technology for Cultivating a Deeper Connection with Your Local Environment

What’s the first thing you do when you wake up in the morning?
If you’re like me, maybe you pick up your phone to turn off the alarm, then check the weather.
Weather is just one aspect of our environment that is changing every day, and we’re able to monitor it through a complex network of sensors, satellites, and communications infrastructure that tells you if it’s going to rain today even before you get out of bed.
Scientists and engineers around the world have developed similarly sophisticated systems to observe other aspects of our environment, such as how quickly polar ice is melting, the extent of coral bleaching, and land cover changes such as urbanization and deforestation.
Did you know that most of the data they’ve collected to track these changes is available online and can be accessed for free?
Let me show you how you, too, can monitor environmental changes in your corner of the world.
Observing Seasonal Changes with Landsat
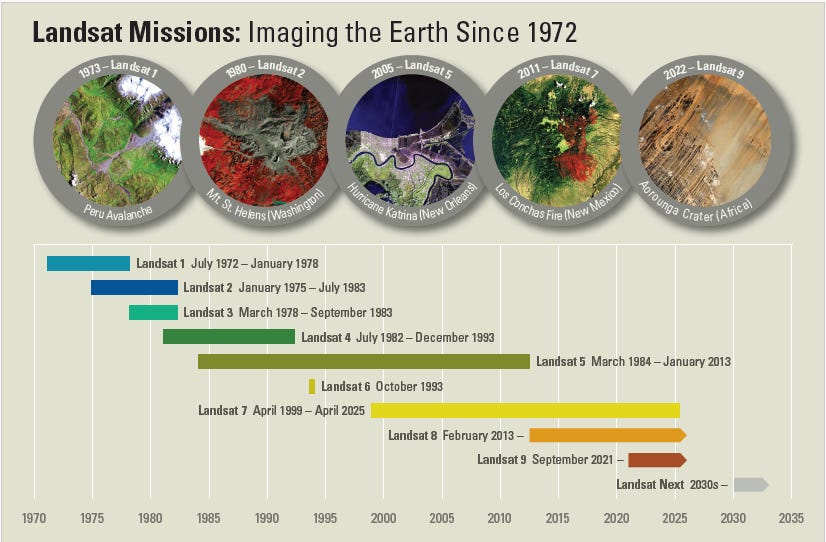
In 1972, the Landsat series of satellites started collecting imagery of Earth’s surface. Since then, these satellites have been taking pictures of every place on Earth every eight days up to the present day, with planned missions to continue observations into the future.
There are several ways to access the data from the Landsat missions, but for this tutorial, we’ll access the imagery from NASA Worldview.
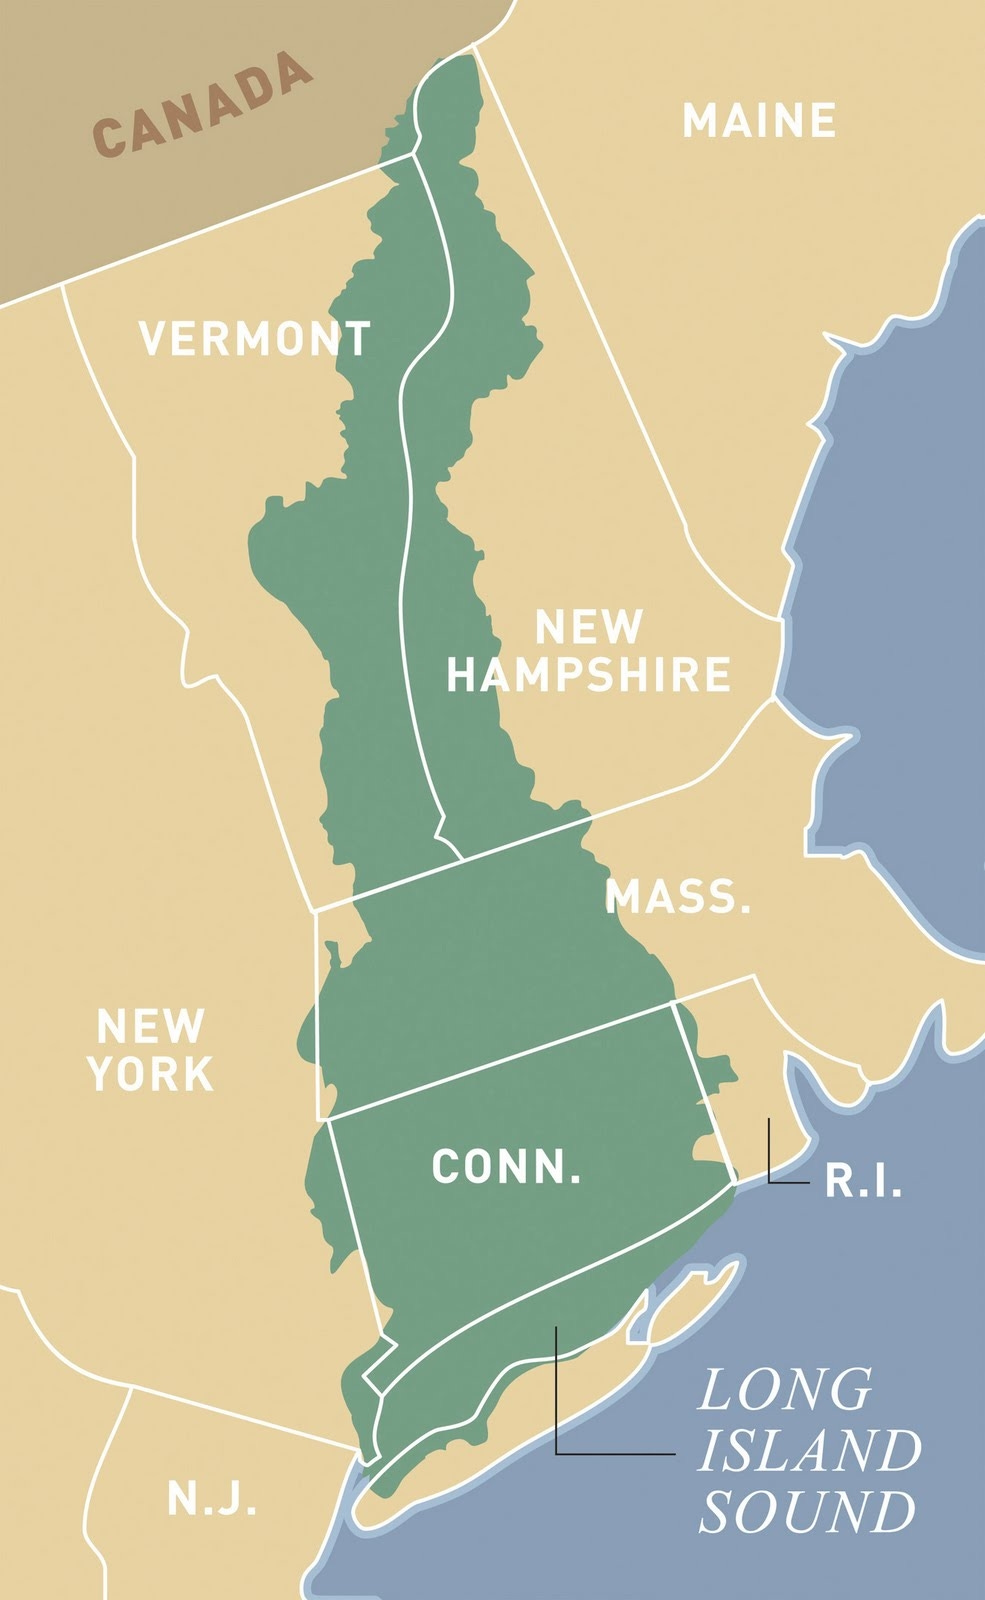
Let’s compare a winter and summer image of the Long Island Sound and surrounding areas. I chose this water body because it’s connected to where I live in Western Massachusetts, which is located in the Connecticut River Valley. All the rain and snow that falls here eventually drains into the Connecticut River, which then flows into the Long Island Sound.
Tutorial
Following along with this video tutorial, or the written instructions with pictures below.
Video
Written Instructions with Pictures
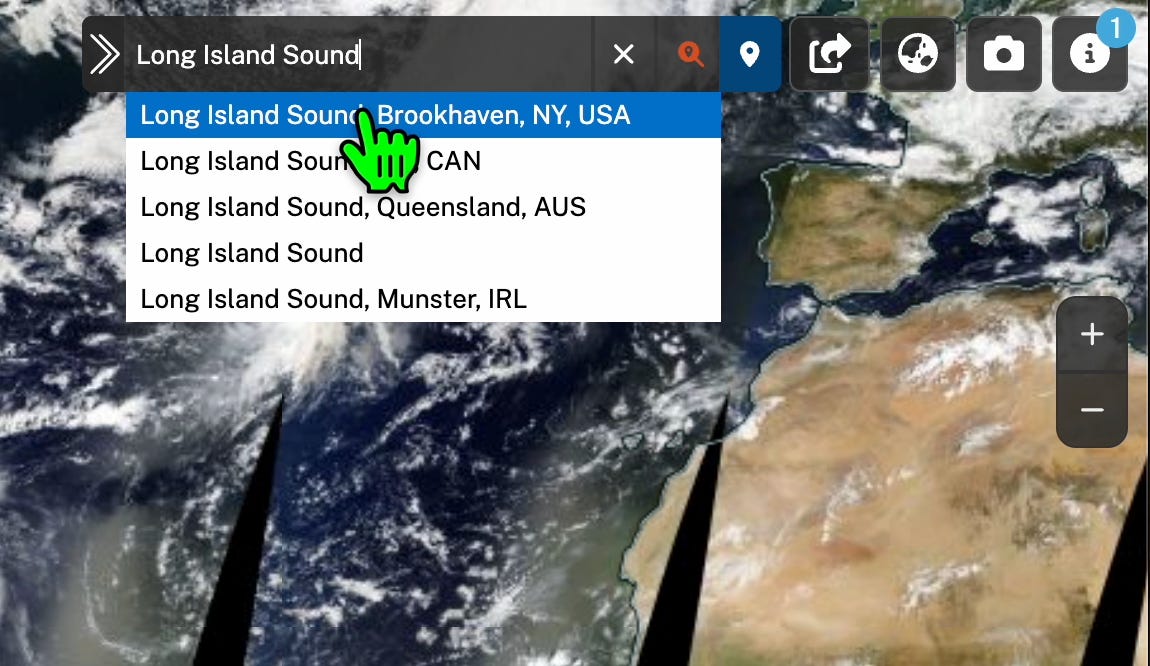
Go to NASA Worldview, and search for “Long Island Sound.” You’ll see a pin for the location, and the map will zoom in.
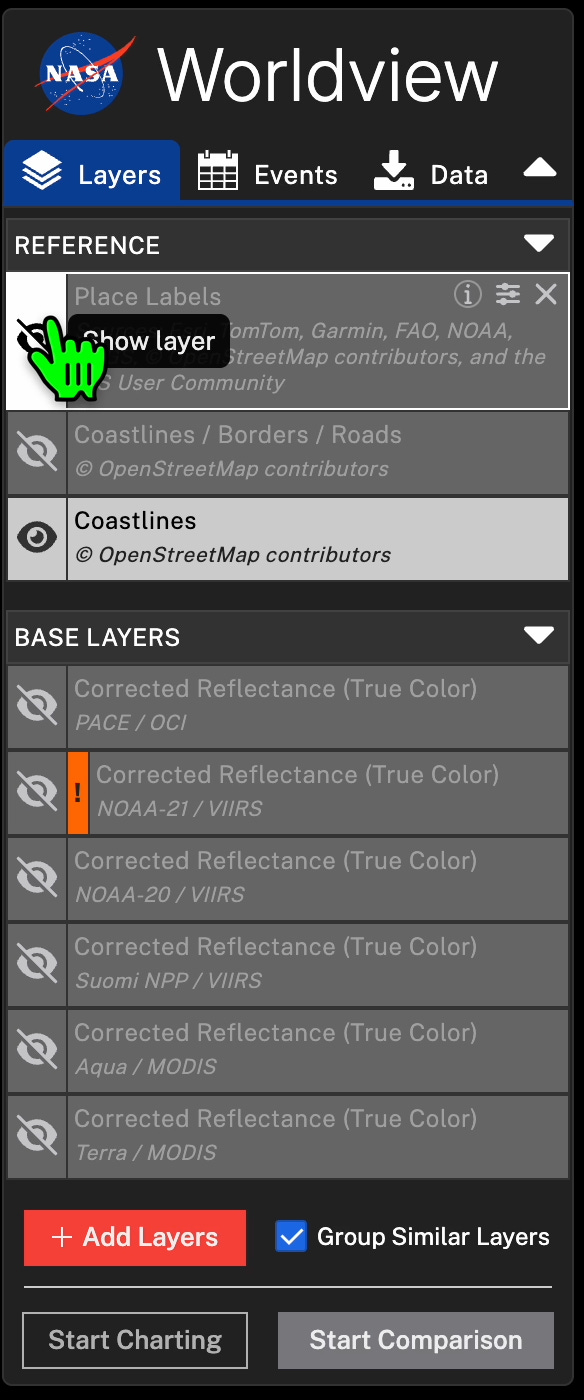
Hide the currently loaded imagery, under the “Base Layers” section, by clicking the eye icon next to it. We will load the Landsat imagery in a future step.
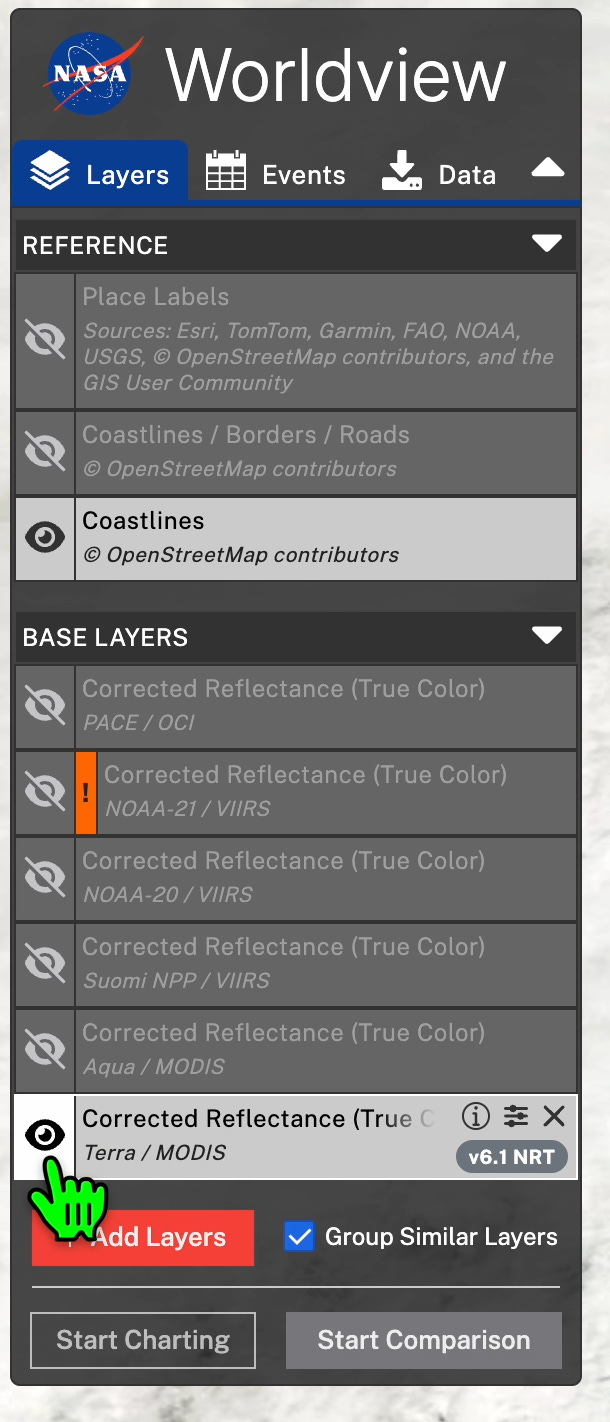
Reveal the “Place Labels” reference layer by clicking the crossed-out eye next to it.
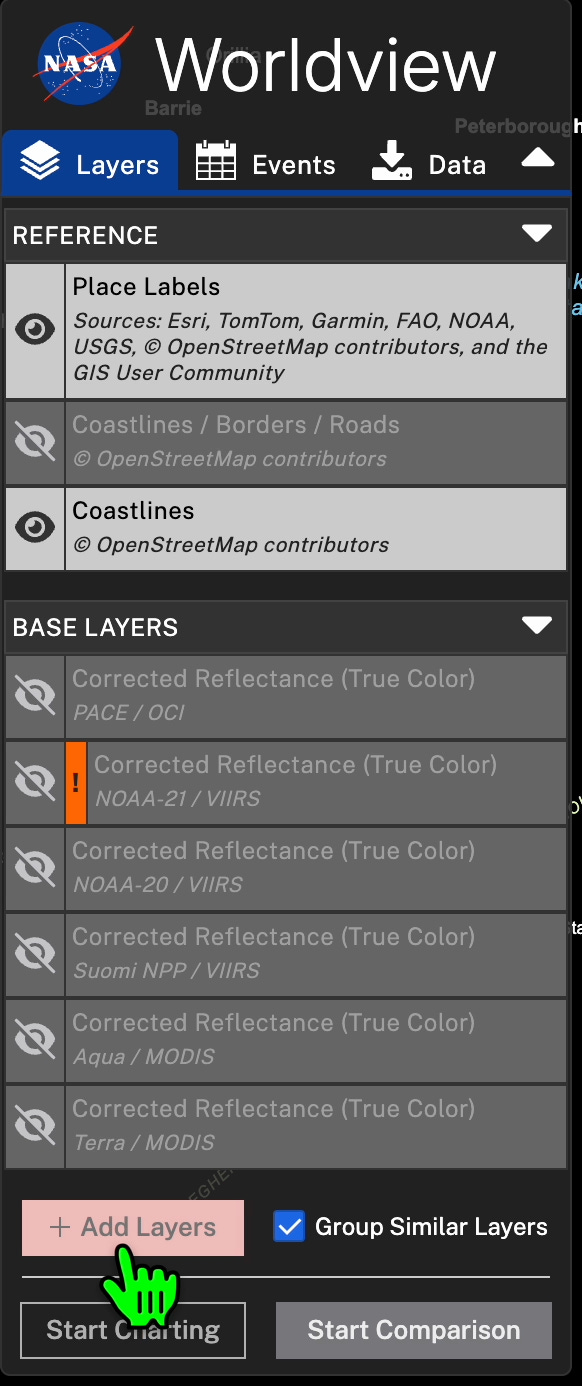
Click on the “+ Add Layers” button.
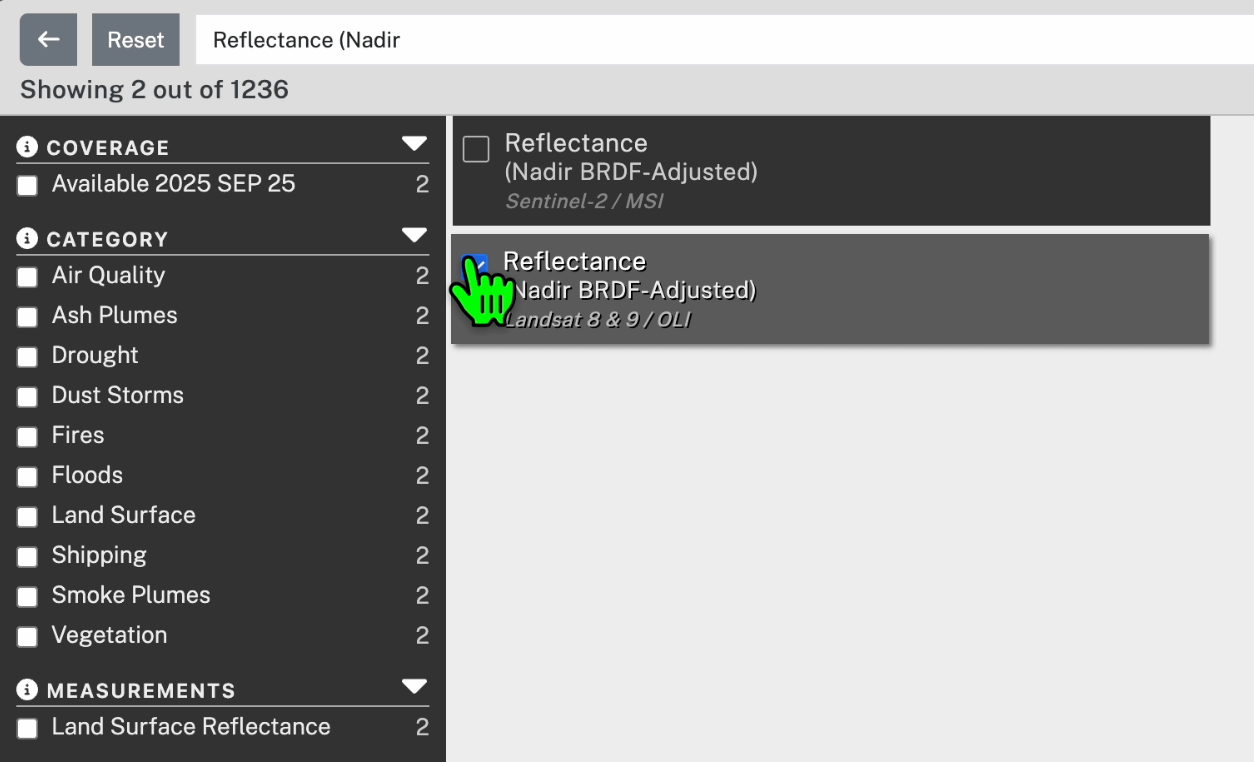
Enter “Reflectance (Nadir BRDF-Adjusted)” into the search bar. You’ll see two options. Select the second one, with “Landsat 8 & 9 / OLI.” Close the window.
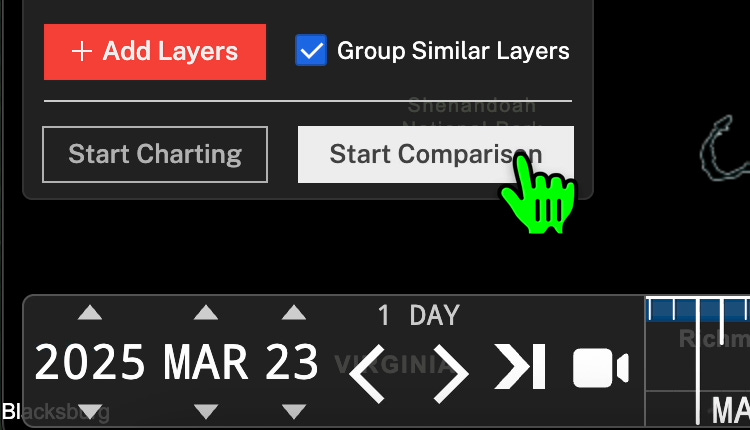
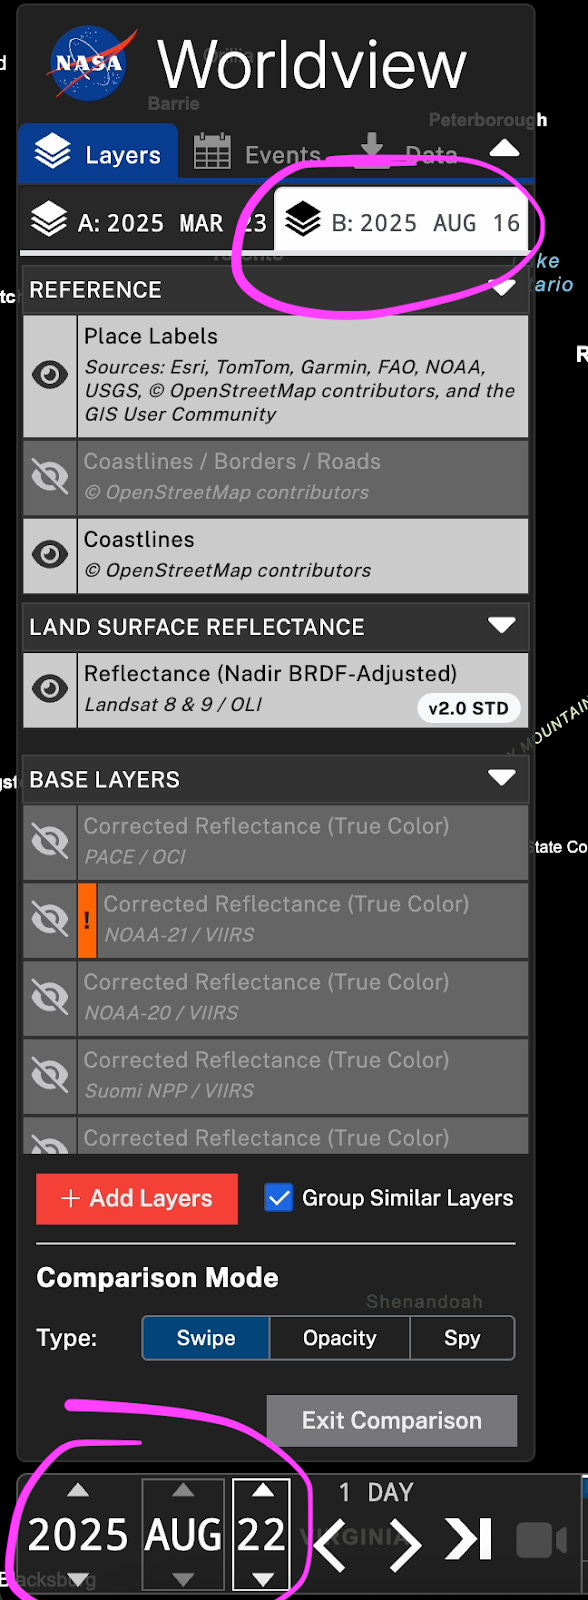
Now go to the date selector, and enter “2025 MAR 23.” Then select the “Start Comparison” button.
Another tab will appear on the sidebar with a different date. Select the new tab, starting with “B:,” and change the date to “2025 AUG 22.”
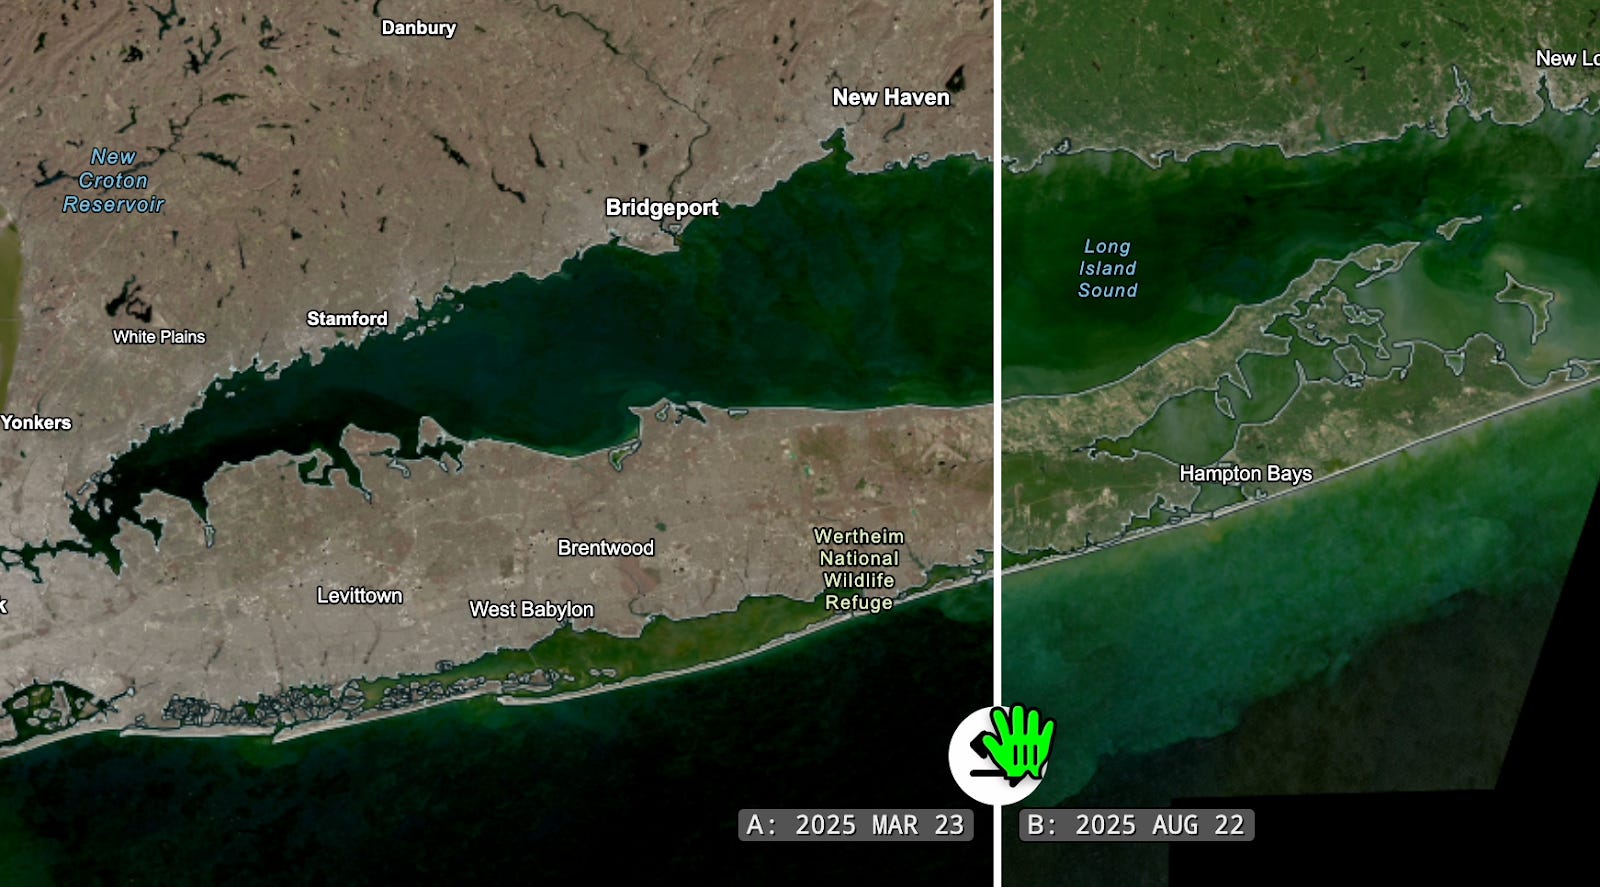
Now you can compare images from winter and summer with a few different comparison options. Under “Comparison Mode,” try out each of the three options: “Swipe,” “Opacity,” and “Spy.”
Swipe:
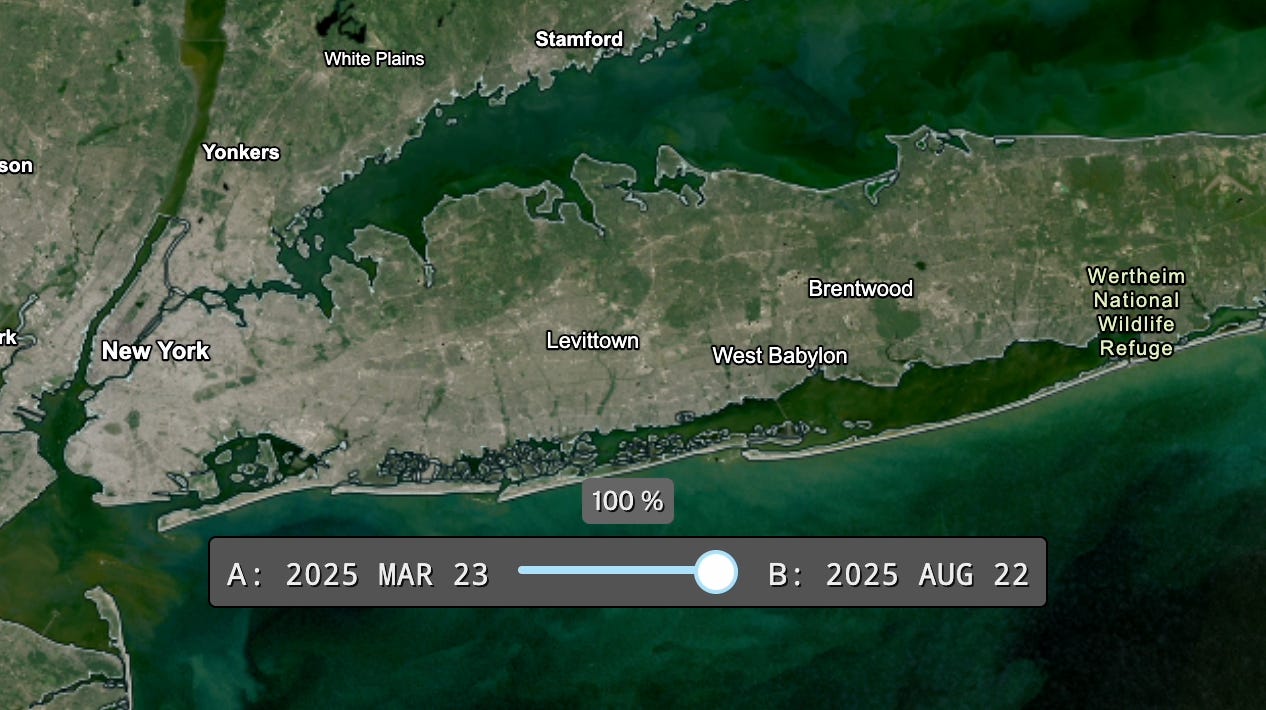
Opacity:
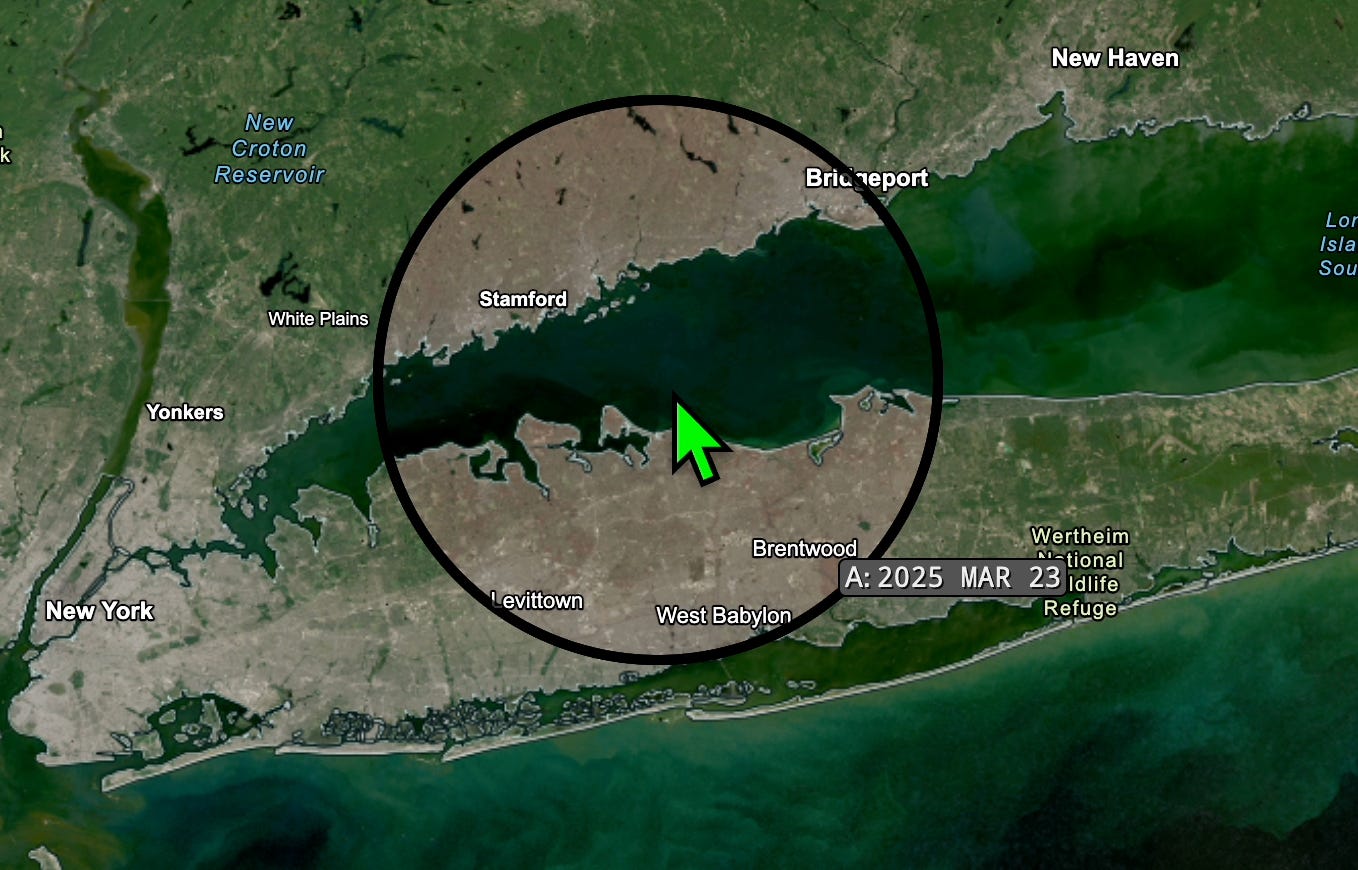
Spy:
Using your method of choice, compare the two images. What’s the same, and what’s different?
Some Suggestions:
Notice how the landscape is transformed from winter to summer, with grays and browns transforming into a blanket of green across the region. Which places are gray throughout the year, and why?
Compare the Connecticut and Hudson rivers on both dates. Late winter snow melt and storms fill the rivers with sediment, turning the rivers brown and gray. The sediment enters the estuaries, visible as plumes at the river mouth.
Zoom way out and pan North. Can you see the snow on the ground in March, and the little white puffy clouds in August?
Now pan South to see the turquoise waters of The Bahamas and Cuba.
Explore somewhere new
Now you try!
Is there somewhere in the world you’d like to see that changes throughout the year? Could you use this imagery to see how your local landscape transforms from season to season?
Repeat the steps above, but with a different location and dates.
You may run into a few issues finding imagery. Here’s how to troubleshoot them:
There’s no imagery on the date I selected.
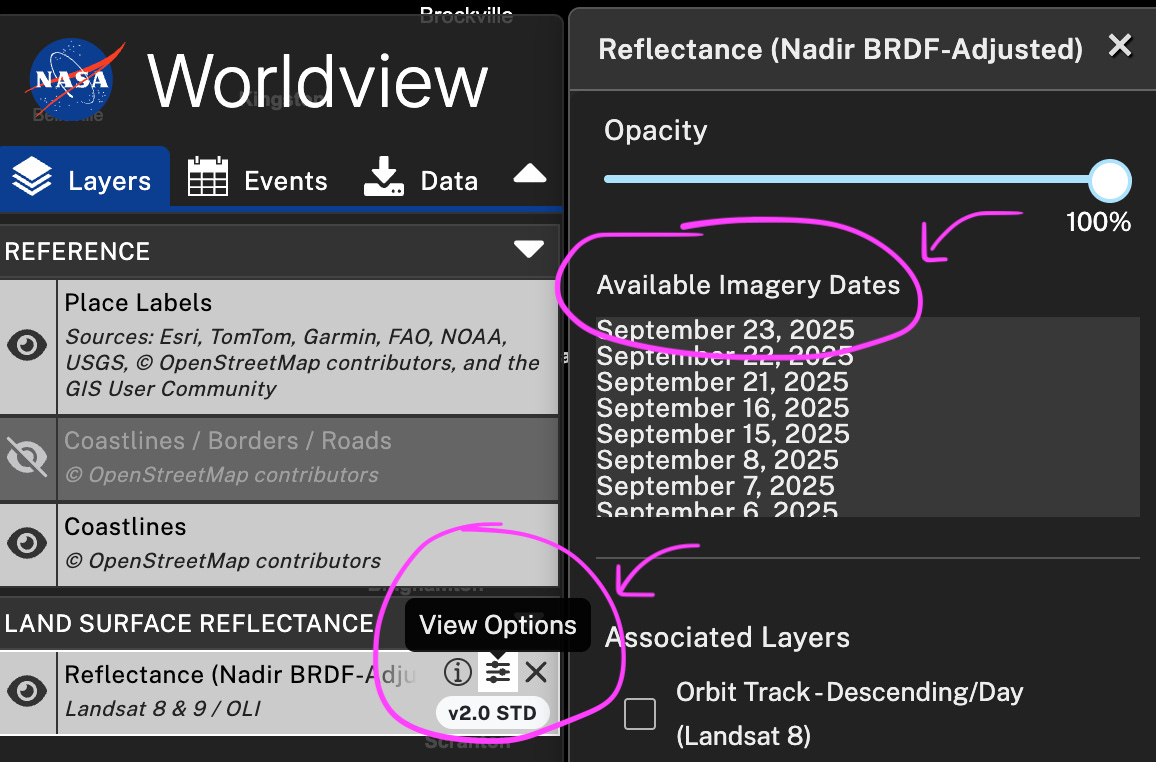
Landsat revisits places approximately every 8 days, and some imagery may be unavailable due to quality issues. To find the dates with available imagery, select the “View Options” icon of the Land Surface Reflectance layer, and a window will appear with the “Available Imagery Dates.”
I can’t see the location I want to see because there are clouds in the way.
This is an issue scientists deal with all the time! Choose another date to find a clearer image.
The imagery looks funny. For example, there are stripes, and the image just looks wrong.
Sometimes the camera on the satellite isn’t working correctly, or there’s something really bright in the image (like very bright ice or snow) that can compromise the entire image. Try selecting another day.
I’ve zoomed in on my location of interest, but it’s so blurry I can’t see the things I want to see, like my house.
This particular satellite mission is designed for observing large areas, not fine details. Every satellite mission has to account for some trade-offs. The more detailed the imagery is, the less frequently it can take images of the whole Earth. Since the Landsat mission series was built for whole-Earth observation, it isn’t the best for identifying for individual objects. If you need highly detailed imagery, you’ll have to look to other (usually paid) imagery sources from private satellite imaging missions.
Thanks for following along!
Grace Kim, PhD is a data and AI consultant helping organizations navigate technological change. Learn more about her work at mappinginsight.com.
Acknowledgements
Special thanks to the Johns Hopkins University Department of Earth and Planetary Sciences for instruction and mentorship in satellite imagery Earth observation.
Nicole Williams, writer/editor, for editorial review of this post. Check out her environmental journalism on Substack and Muck Rack.